Portfolio Item Item Subheading
A data visualization project for COGS 121.
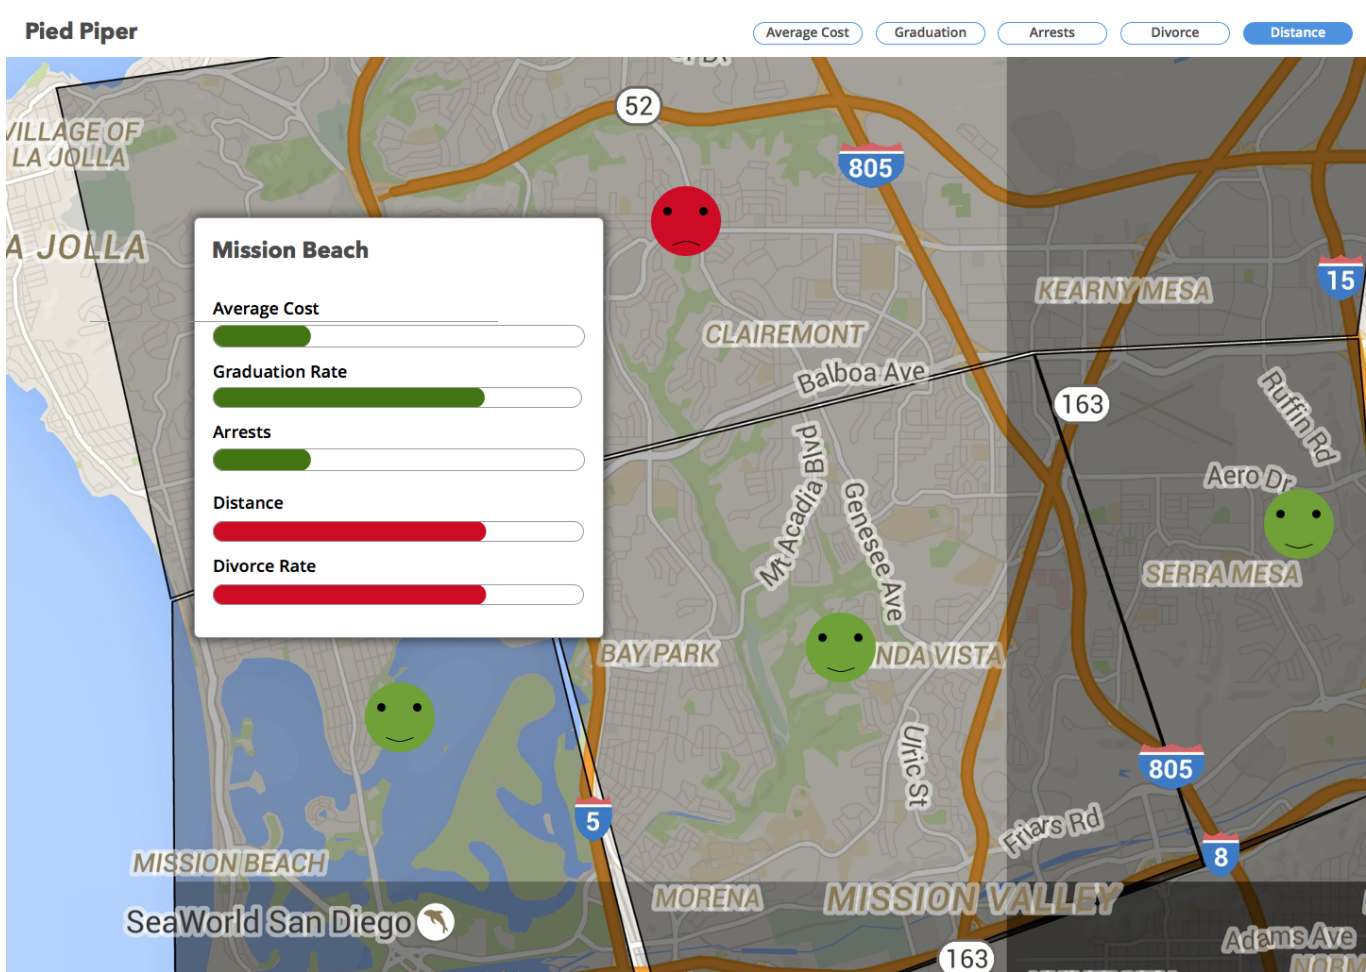
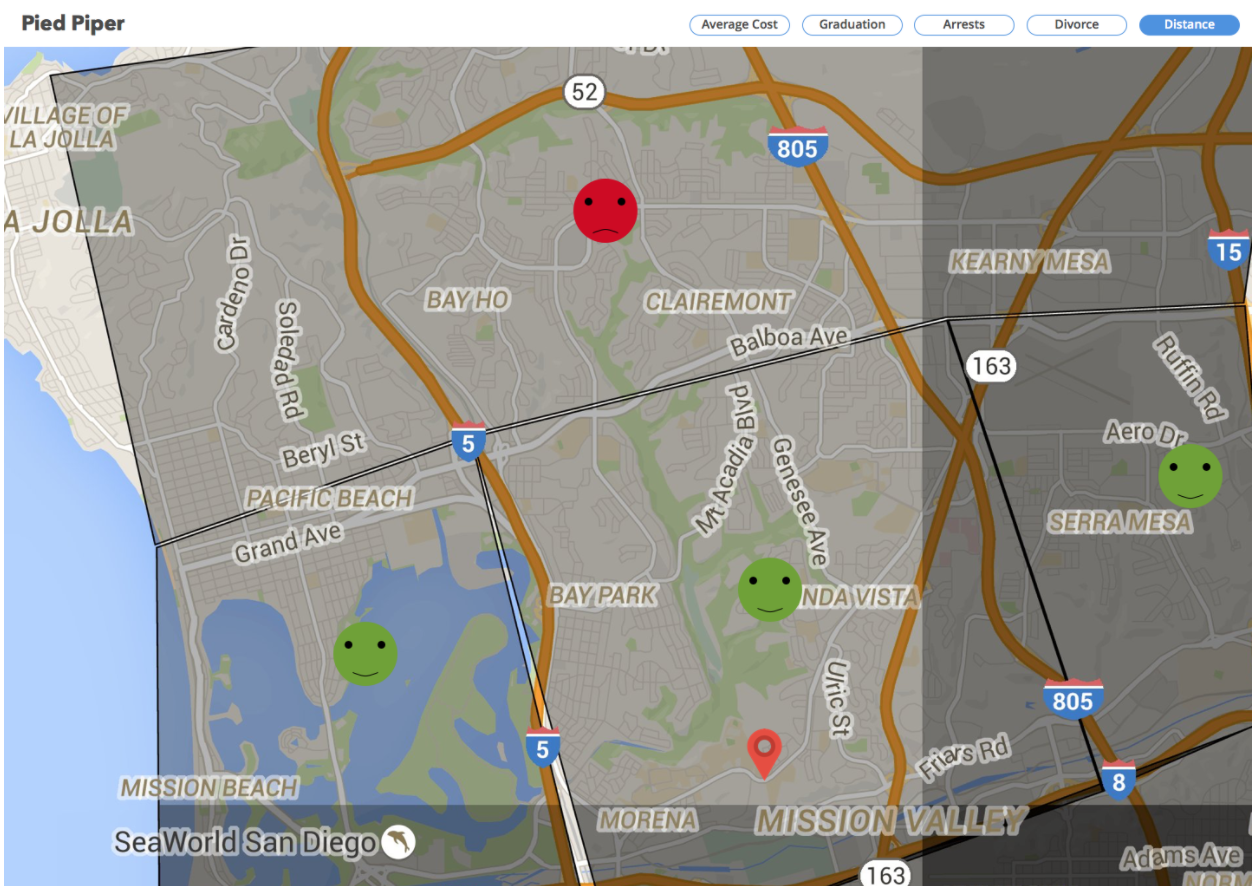
Our group wanted to help users find the perfect home based on their workplace and other points of interest. By hovering over the map, a number of data visualizations will show up on the sidebar, such as price, average income, average number of children, etc.
Project Details
- I was a developer on this project.
- We used node.js and D3.js for our visualizations.
Github
github.com/kimberlyly/piedpiperScreenshots